2022 Annual BOAST Report
2022 Annual BOAST Report
Cannabis Beverages
First off, I would like to say I am very sorry for the delay in this report. I fully planned on releasing it in mid-January, but I failed to gauge the efforts needed to start up our new Flavor Fusion California facility. It has been one heck of a project, and we are excited to begin producing our excellent lineup of Cannabis Beverages.
To say it’s been a wild ride for the entire cannabis industry this year would be an understatement. Oversupply has resulted in price compression in markets across the USA and Canada. We have seen big companies pulling out of states and many large MSOs posting loss after loss. During the Pandemic, the industry got used to setting records, month after record month, in cannabis sales, but with the return to normal coupled with inflation and recession, most companies are feeling the pinch. Investors have grown cold to the cannabis industry, and the ones that have not are offering capital at rates that many of us simply can’t afford to take. But while there are some hardship stories in the Cannabis industry, there are some fun and exciting opportunities for investors within areas of Cannabis. I do not claim to know about investing, nor should you consider this report my recommendation of where to invest, but rather a tool to educate anyone reading this report on the year in Cannabis Beverages. I hope you find it informational.
2022 was a successful year for many Cannabis Beverage Companies. With a handful expanding to multiple states or international operations. The Cannabis Beverage segment of the Cannabis industry has seen growth from 1.1 % of the total cannabis market share in 2021 to 1.2% in 2022. That is an increase of 9.1%. Total sales of Cannabis Beverages jumped 10.45%, going from 167.4 million in sales in 2021 to 184.9 million in 2022, and total units jumped from 13.8 million in 2021 to 16.7 million units sold in 2022, an increase of 21%. In today’s cannabis environment, that is a huge success story. Great job to all those companies out there grinding to make it happen. Many companies are self-funded or have received very little funding to this point. Some have received large amounts of funding, and there is no correlation between funding and success. Consumers continue to demonstrate that price per milligram matters to them when making their purchasing decisions. Even with the success that some companies are having, they continue to have financial struggles to grow and expand. Whether you own your own bottling facilities or you are working through co-packaging agreements, we have all had our share of hurdles to overcome.
Some Challenges Cannabis Beverage Manufactures are faced with:
Banking continues to be a problem with very limited capital options, even for companies that are posting great profits. With failed attempt after failed attempt, we are all hopeful that Safe Banking comes at a point and that it is not too late for most. Growth takes significant resources. If a company wants to posture for the future, growth must happen, innovation must happen, and partnering with the right partners is as important as anything else.
Slow or no-pay accounts prove to be a continued problem in markets like California. I have heard as many as 110 of the 250 accounts that a friend’s company sold into last year did not pay their bills at all. Of course, they no longer sell to those stores, but the loss in revenue from this practice is common in some states. Other states, like Washington, mandate the retailer to remit payment on delivery. If a company is deeply funded, it may be able to absorb the loss, but most of the Cannabis Beverage companies out there are smaller self-funded companies.
Regulations are so widely different from state to state. They may require completely different packaging and labels, dosages per serving or container, and quantities that may be sold to a customer. Almost ten years after some states legalized recreational consumption, we are still regulated so incredibly differently from alcohol. Can you imagine if beer companies had to have a different label or package for every state they sold to? Come on, regulators, let’s level the playing field and understand that the population voted to have recreational cannabis products. If it is as legal as alcohol, why can’t we get some consistent regulation from state to state for business continuity purposes?
It is important to remember to keep your eye on the prize, press forward with intentionality, have a plan, execute, and innovate, innovate, innovate!! Companies that innovate will move further into the future. The ones that do not will simply be outperformed by the ones that do. It is proven over and over again. As I start into the data you came to read about today, I would like to quote what my late father, Rodney Boast Sr, said every time I whined about it being difficult to own, manage, and grow a brand in cannabis or any business for that matter. He would simply smile and say, “If it were easy, everybody would do it”!! He couldn’t be more right. It’s a beautiful, wild, fun, and exciting ride we are all on. Hang on, stay focused, and be intentional.
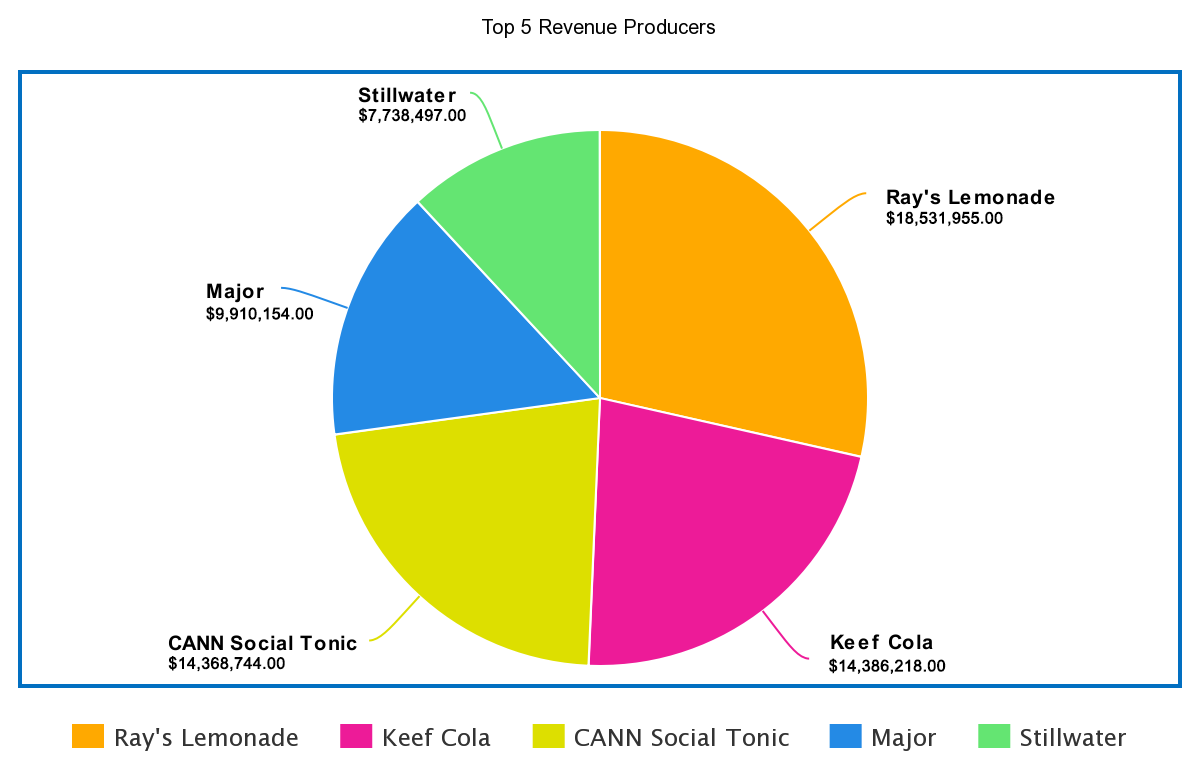
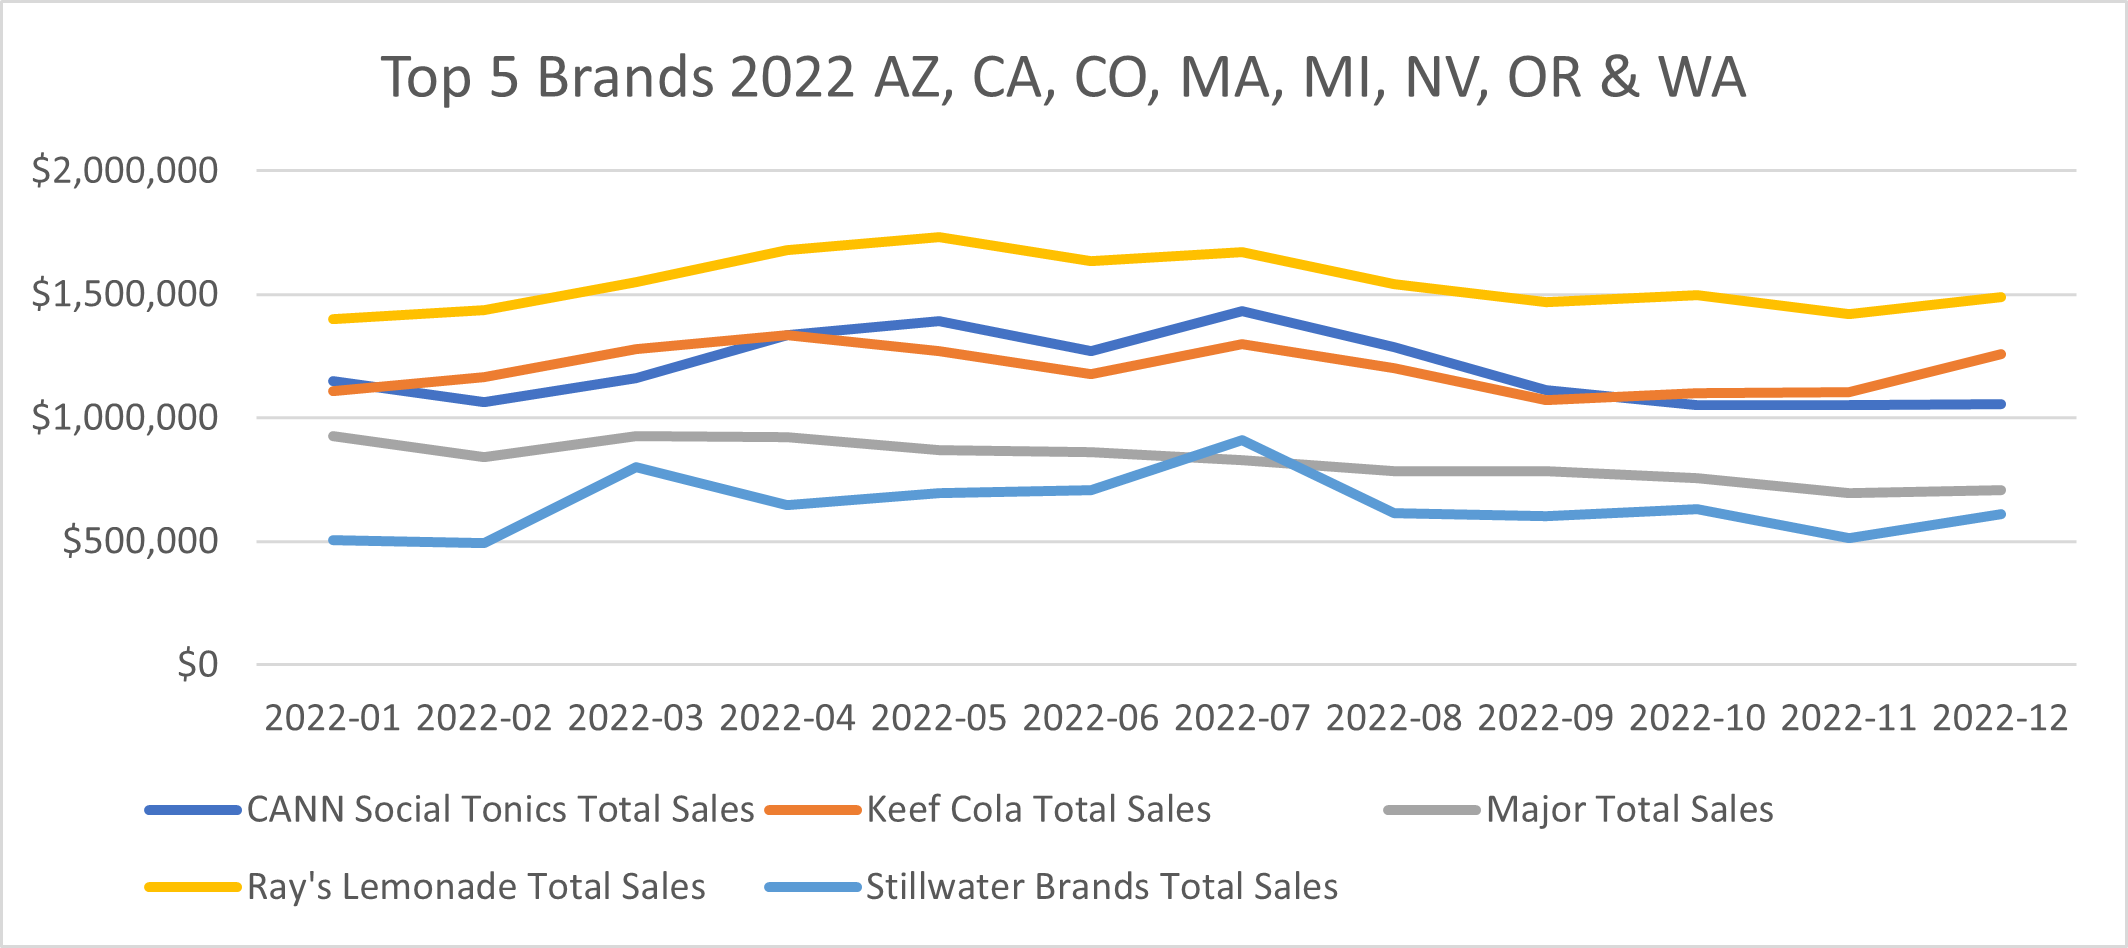
Top 5 Cannabis Beverages Brands in 2022
The data represented below is from AZ, CO, CA, WA, OR, NV, MI, and MA. Some of the top 5 are in multiple states. I will highlight each brand by revenue in each state.
| Ray’s Lemonade | $18,531,955.00 | WA | |
| Keef Cola | $14,386,218.00 | AZ, CA, CO, OR | |
| CANN Social Tonic | $14,368,744.00 | AZ, CA, MA, NV | |
| Major | $9,910,154.00 | WA, OR, NV, CO, CA, AZ | |
| Stillwater | $7,738,497.00 | CO, MI | |
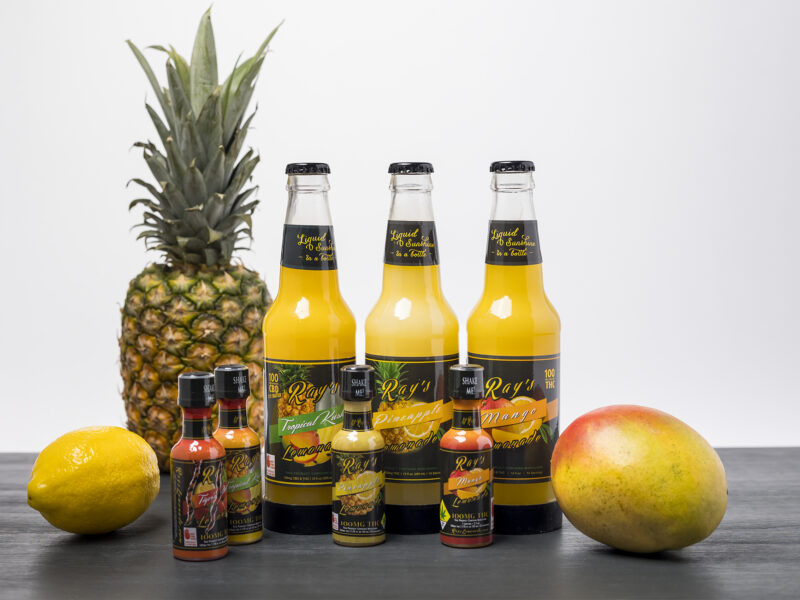
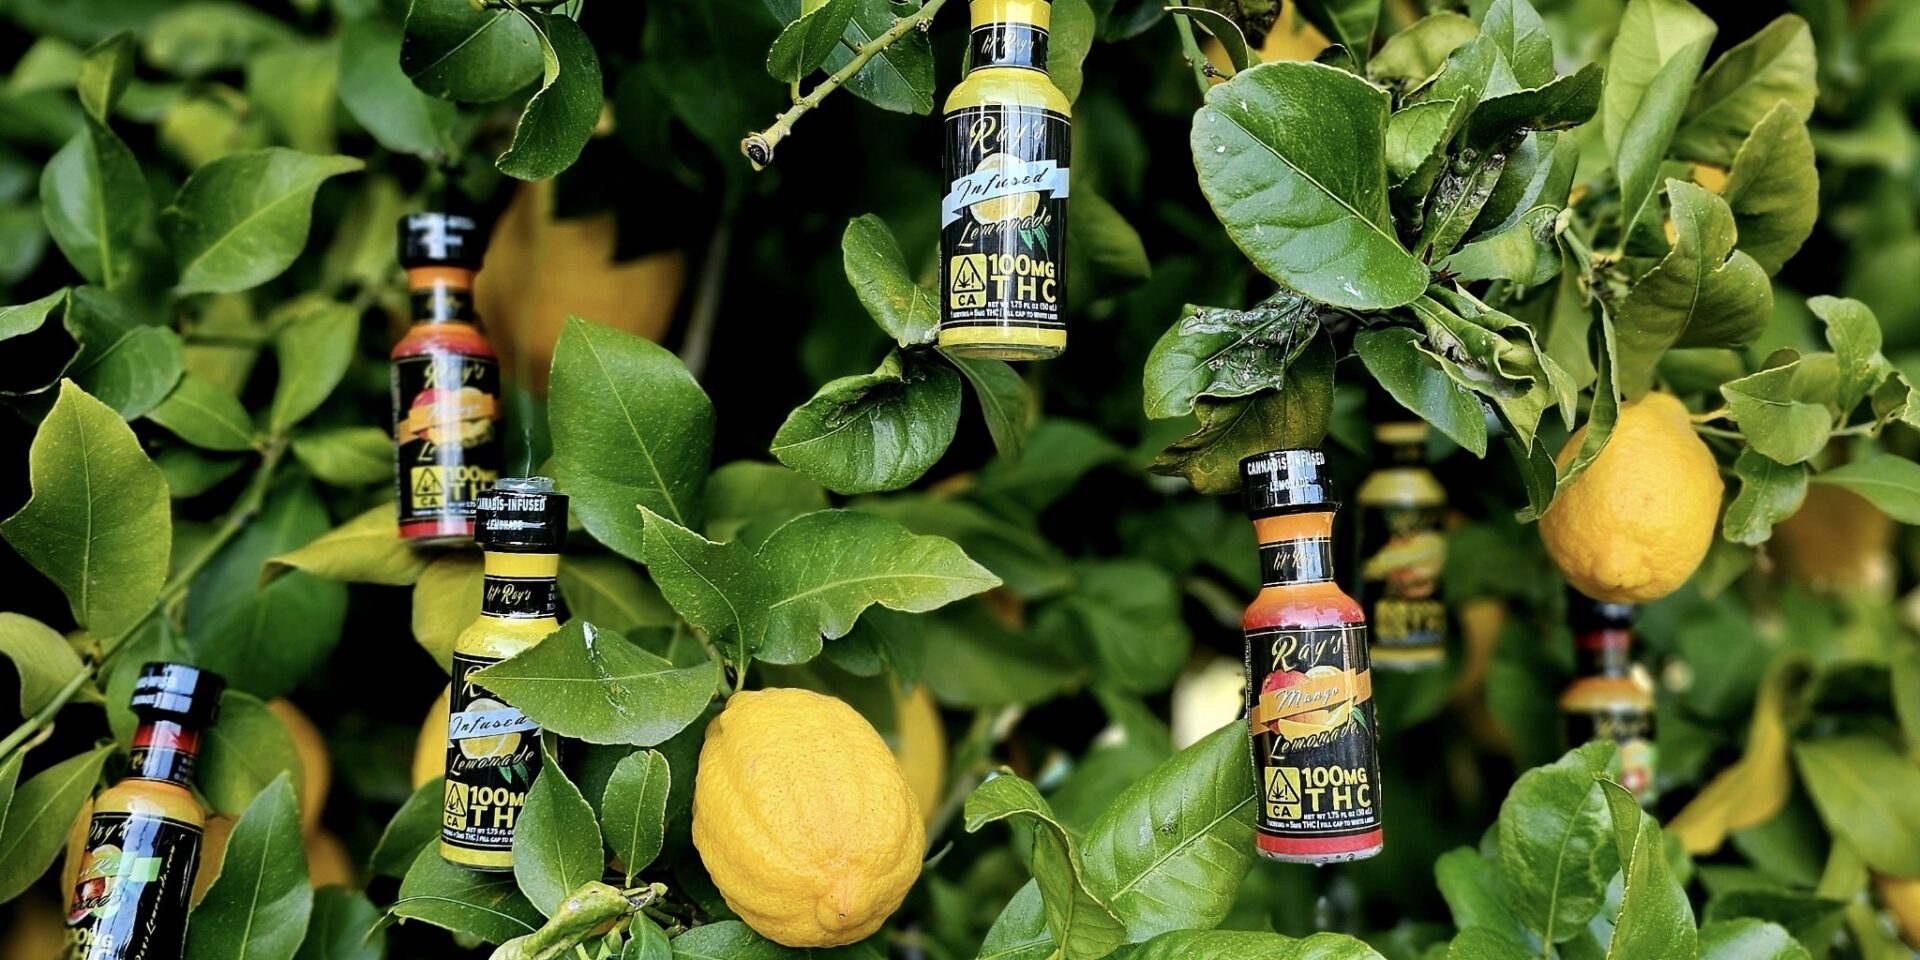
Ray’s Lemonade: $18,531,995 in retail sales, of which 100% of sales are from Washington.
| Washington (home) | 100% | $18,531,995 |
Keef Cola: Keef is currently selling in 4 states that I have data for. $14,386,218 in retail sales.
| Colorado (home) | 44% | $6,358,553 |
| California | 36% | $5,247,803 |
| Arizona | 18% | $2,591,511 |
| Oregon | 1% | $187,592 |
CANN Social Tonic: CANN is currently selling in 4 states that I have data for. $14, 368,995 in retail sales.
| California (home) | 66% | $9,432,181 |
| Massachusetts | 26% | $3,670,191 |
| Nevada | 8% | $1,108,264 |
| Arizona | 1% | $86,109 |
Major: Major is currently selling in 5 States I have data for. $9,910,154 in retail sales.
| Washington (home) | 82% | $9,095,409 |
| California | 11% | $1,117,901 |
| California | 2% | $243,849 |
| Arizona | 2% | $244,950 |
| Colorado | 2% | $208,045 |
Stillwater Brands: Stillwater brands sell products in two states that I have data for. $7,738,497.00 in retail sales.
| Colorado (home) | 82% | $6,374,078 |
| Michigan | 18% | $1,364,419 |
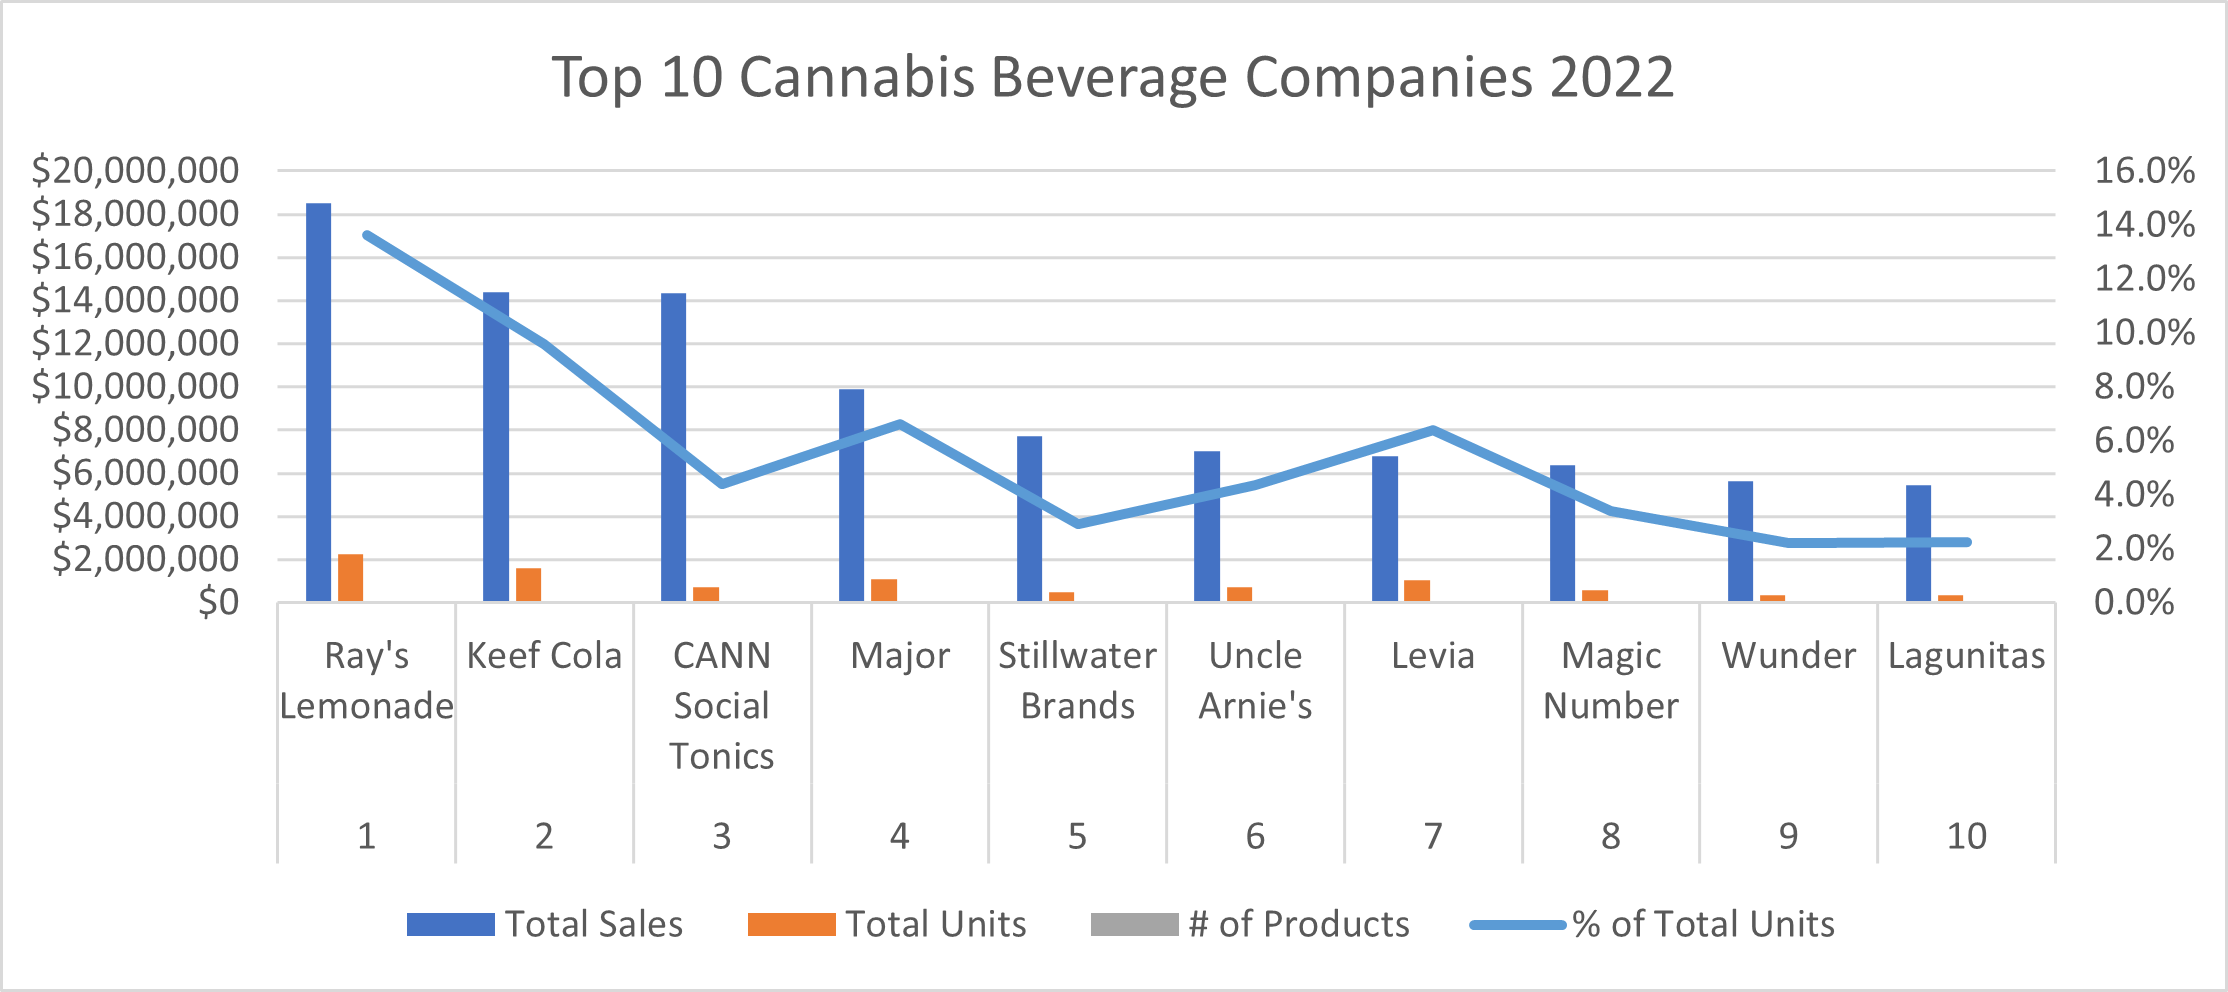
Let’s take a look at the top 10 Cannabis Beverage Companies for 2022. Congrats to all of the companies who made the top 10 list for 2022.
State Breakdown:
Let’s now look at each state to see who the top 10 Cannabis Beverage companies are in each state. There has been a lot of movement in this list for 2022. Make sure you check out previous Boast reports for Q1-Q3 2022 to see what changed.
Arizona:
Arizona is a new data state for the Boast report. Arizona grew the total market share of Cannabis Beverages from 0.5% market share in 2021 to 0.7% market share in 2022 for a change of 40% in total market share. They increased the revenue of Cannabis Beverages sold from $7.4 million in 2021 to $9.3 million in 2022 for a change of 25.7% more revenue. Lastly, they sold 60.1% more units growing from 412k units in 2021 to 659.6k units sold in 2022. Nice work Arizona!! Keeping it going.
| Brand Name | Total Sales | Total Units | # of Products | % of Total Sales | % of Total Units | |
| 1 | Keef Cola | $2,591,511 | 197,864 | 20 | 28.0% | 30.0% |
| 2 | Sprinkle | $1,111,039 | 51,443 | 10 | 12.0% | 7.8% |
| 3 | Nebula | $1,003,290 | 55,611 | 26 | 10.8% | 8.4% |
| 4 | Baked Bros | $710,018 | 31,241 | 36 | 7.7% | 4.7% |
| 5 | Sip Elixirs | $690,726 | 80,691 | 6 | 7.5% | 12.2% |
| 6 | House Brand | $595,332 | 40,270 | 14 | 6.4% | 6.1% |
| 7 | Tonic | $483,555 | 29,171 | 10 | 5.2% | 4.4% |
| 8 | Haze & Main | $458,469 | 36,023 | 5 | 5.0% | 5.5% |
| 9 | Pure & Simple | $250,122 | 14,728 | 4 | 2.7% | 2.2% |
| 10 | Major | $244,950 | 17,951 | 6 | 2.6% | 2.7% |
California:
California is the largest revenue generator in Cannabis Beverages. Cannabis Beverage Brands in California grew the total market share from 1.2% in 2021 to 1.4% in 2022 for a 16.6 % change in total market share. They experienced 11.8% more in retail sales growing from $62.5 million in 2021 to $69.9 million in 2022. Lastly, they sold 4.6 million units in 2021, growing to 5.4 million units in 2022 for an increase of 17.4%.
| Brand Name | Total Sales | Total Units | # of Products | % of Total Sales | % of Total Units | |
| 1 | CANN Social Tonics | $9,432,181 | 491,594 | 52 | 13.5% | 9.2% |
| 2 | Uncle Arnie’s | $7,007,262 | 725,884 | 9 | 10.0% | 13.5% |
| 3 | Wunder | $5,614,521 | 371,509 | 22 | 8.0% | 6.9% |
| 4 | Lagunitas | $5,426,953 | 372,380 | 21 | 7.8% | 6.9% |
| 5 | Keef Cola | $5,247,803 | 599,266 | 29 | 7.5% | 11.2% |
| 6 | Tonik | $3,648,292 | 360,814 | 66 | 5.2% | 6.7% |
| 7 | Habit | $3,352,109 | 155,524 | 39 | 4.8% | 2.9% |
| 8 | Cannavis Syrup | $2,857,655 | 85,476 | 73 | 4.1% | 1.6% |
| 9 | CQ (Cannabis Quencher) | $2,764,757 | 224,581 | 23 | 4.0% | 4.2% |
| 10 | Manzanita Naturals | $2,693,643 | 296,852 | 23 | 3.9% | 5.5% |
Colorado:
Colorado sees an increase of 9.1% in total market share growing from 1.1% market share in 2021 to 1.2% market share in 2022. Despite this growth, Colorado saw a reduction in total revenue of -14.35%, dropping from $20.9 million in 2021 to $17.9 million in 2022. Total units sold also dropped in Colorado from 1.8 million units sold in 2021 to 1.5 million units sold in 2022 for a -16.70% reduction in units sold.
| Brand Name | Total Sales | Total Units | # of Products | % of Total Sales | % of Total Units | |
| 1 | Stillwater Brands | $6,374,078 | 357,644 | 13 | 35.6% | 23.7% |
| 2 | Keef Cola | $6,358,553 | 778,187 | 45 | 35.5% | 51.7% |
| 3 | Dixie Elixirs | $1,632,900 | 98,720 | 11 | 9.1% | 6.6% |
| 4 | CannaPunch | $997,355 | 54,670 | 19 | 5.6% | 3.6% |
| 5 | Dialed In Gummies | $621,349 | 27,967 | 76 | 3.5% | 1.9% |
| 6 | marQaha | $448,463 | 37,072 | 15 | 2.5% | 2.5% |
| 7 | Oh Hi | $366,298 | 56,357 | 10 | 2.0% | 3.7% |
| 8 | Major | $208,045 | 16,340 | 9 | 1.2% | 1.1% |
| 9 | Bosky Labs | $185,875 | 10,451 | 19 | 1.0% | 0.7% |
| 10 | ebb. | $185,013 | 12,285 | 4 | 1.0% | 0.8% |
Massachusetts:
Massachusetts grew the total market share of Cannabis Beverages from 1.0 % in 2021 to 1.2% in 2022 for a 20% increase in total market share. Retail sales numbers for Cannabis Beverages jumped from $12.8 million in 2021 to $17.8 million in 2022 for an increase of 39.1%. There were more units sold in 2022 climbing from 1.4 million units sold in 2021 to 2 million units sold in 2022 or 42.8% more units sold.
| Brand Name | Total Sales | Total Units | # of Products | % of Total Sales | % of Total Units | |
| 1 | Levia | $6,777,598 | 1,065,778 | 17 | 38.2% | 54.6% |
| 2 | CANN Social Tonics | $3,670,191 | 165,148 | 24 | 20.7% | 8.5% |
| 3 | Hi5 Seltzer | $2,434,891 | 191,437 | 34 | 13.7% | 9.8% |
| 4 | Cantrip | $1,049,241 | 199,607 | 10 | 5.9% | 10.2% |
| 5 | Select | $866,983 | 28,508 | 7 | 4.9% | 1.5% |
| 6 | House Brand | $774,644 | 97,803 | 16 | 4.4% | 5.0% |
| 7 | Vibations: High + Energy | $644,391 | 31,913 | 4 | 3.6% | 1.6% |
| 8 | Good Feels Inc | $483,515 | 36,419 | 9 | 2.7% | 1.9% |
| 9 | Wynk | $321,493 | 37,392 | 7 | 1.8% | 1.9% |
| 10 | Endless Coast | $155,213 | 39,900 | 6 | 0.9% | 2.0% |
Michigan:
Michigan increased the total cannabis market share of Cannabis Beverages from 0.2% to 0.4% for a 100% increase in total cannabis market share. They celebrated an increase of revenue in retail sales of 169% jumping from $3.3 million sold in 2021 to $8.9 million sold in 2022. Michigan saw an increase of 397% in units sold jumping from 177.1k units sold in 2021 to 848.7k units sold in 2022.
| Brand Name | Total Sales | Total Units | # of Products | % of Total Sales | % of Total Units | |
| 1 | Chill Medicated | $1,755,580 | 92,290 | 23 | 19.7% | 10.9% |
| 2 | Stillwater Brands | $1,364,419 | 126,285 | 11 | 15.3% | 14.9% |
| 3 | Dixie Elixirs | $1,060,343 | 57,635 | 8 | 11.9% | 6.8% |
| 4 | Select | $999,509 | 60,580 | 7 | 11.2% | 7.1% |
| 5 | Tonic | $848,866 | 63,876 | 3 | 9.5% | 7.5% |
| 6 | Wynk | $742,440 | 222,247 | 7 | 8.3% | 26.2% |
| 7 | Northern Connections | $656,783 | 36,680 | 10 | 7.4% | 4.3% |
| 8 | CYP | $332,174 | 90,073 | 10 | 3.7% | 10.6% |
| 9 | House Brand | $250,225 | 19,081 | 2 | 2.8% | 2.2% |
| 10 | Magic Edibles | $221,345 | 10,956 | 8 | 2.5% | 1.3% |
Nevada:
Nevada was the lowest-performing state in 2022 losing ground in all areas. They dropped by -9.1% from 1.1% total market share in 2021 to 1.0 total market share in 2022. Retail revenue numbers dropped by -17.92% with $10.6 million sold in retail sales in 2021 to $8.7 million in retail sales in 2022 and lastly from 1 million units sold in 2021 to 833.3 thousand units sold in 2022 for a -16.67% reduction in units sold.
| Brand Name | Total Sales | Total Units | # of Products | % of Total Sales | % of Total Units | |
| 1 | Sip Elixirs | $3,019,388 | 334,951 | 7 | 34.8% | 40.2% |
| 2 | CANN Social Tonics | $1,180,264 | 72,068 | 25 | 13.6% | 8.6% |
| 3 | Select | $673,744 | 30,716 | 7 | 7.8% | 3.7% |
| 4 | Sips | $664,365 | 72,454 | 2 | 7.7% | 8.7% |
| 5 | CannaPunch | $594,142 | 34,120 | 14 | 6.9% | 4.1% |
| 6 | HaHa | $560,161 | 94,559 | 13 | 6.5% | 11.3% |
| 7 | Cannalean | $503,559 | 39,656 | 13 | 5.8% | 4.8% |
| 8 | Mellow Vibes (formerly Head Trip) | $408,780 | 47,968 | 17 | 4.7% | 5.8% |
| 9 | PRO Canna | $290,313 | 27,287 | 4 | 3.3% | 3.3% |
| 10 | Canna Hemp | $227,817 | 4,038 | 18 | 2.6% | 0.5% |
Oregon:
Oregon saw an increase in total cannabis market share from 1.6% in 2021 to 1.7% in 2022 for a 6.25% increase. Although the state observed a market share increase, Retail revenue dropped by -7.1% going from $18.3 million dollars retail sold in 2021 to $17.0 million dollars in retail sold in 2022. They experienced a 0% change in units sold with 1.2 million units sold in both 2021 and 2022.
| Brand Name | Total Sales | Total Units | # of Products | % of Total Sales | % of Total Units | |
| 1 | Magic Number | $6,350,395 | 566,761 | 69 | 37.3% | 46.0% |
| 2 | Mule Extracts | $2,263,030 | 87,084 | 26 | 13.3% | 7.1% |
| 3 | Hapy Kitchen | $1,579,856 | 119,326 | 7 | 9.3% | 9.7% |
| 4 | Major | $1,117,901 | 140,528 | 18 | 6.6% | 11.4% |
| 5 | Crown B Alchemy | $1,034,538 | 41,033 | 30 | 6.1% | 3.3% |
| 6 | Mellow Vibes | $677,612 | 27,953 | 14 | 4.0% | 2.3% |
| 7 | Hush | $552,378 | 28,110 | 15 | 3.2% | 2.3% |
| 8 | Herban Tribe | $497,621 | 28,889 | 14 | 2.9% | 2.3% |
| 9 | Private Stash | $425,335 | 42,864 | 5 | 2.5% | 3.5% |
| 10 | Sips | $341,593 | 12,724 | 15 | 2.0% | 1.0% |
Washington:
Washington grew the total cannabis market share from 2.2% in 2021 to 2.8% in 2022 for a 27.3% increase. Retail sales also grew by 12.34% with $31.6 million in retail sales in 2021 to $35.5 million in retail sales in 2022. The number of units sold jumped from 3.2 million units sold in 2021 to 4.3 million units sold in 2022 for an increase of 34.4%.
| Brand Name | Total Sales | Total Units | # of Products | % of Total Sales | % of Total Units | |
| 1 | Ray’s Lemonade | $18,531,955 | 2,274,044 | 46 | 52.2% | 53.0% |
| 2 | Major | $8,095,409 | 901,865 | 11 | 22.8% | 21.0% |
| 3 | Green Revolution | $3,458,874 | 476,598 | 41 | 9.7% | 11.1% |
| 4 | Agro Couture | $1,000,745 | 153,983 | 14 | 2.8% | 3.6% |
| 5 | Sinners & Saints | $948,470 | 126,502 | 25 | 2.7% | 2.9% |
| 6 | Happy Apple | $802,257 | 49,594 | 7 | 2.3% | 1.2% |
| 7 | Blaze Soda | $649,412 | 70,974 | 19 | 1.8% | 1.7% |
| 8 | Fractal Infused | $638,072 | 69,884 | 34 | 1.8% | 1.6% |
| 9 | Journeyman | $342,483 | 48,686 | 4 | 1.0% | 1.1% |
| 10 | Passionflower Cannabis | $201,076 | 27,000 | 7 | 0.6% | 0.6% |
State Score Board listed in order of retail sales. Note the population of each state and the number of tourists.
| State | Market Share% | Revenue | Population | Tourism |
| California | 1.4 | $69,900,000 | 39 Million | 279.1 Million |
| Washington | 2.8 | $35,500,000 | 7.8 Million | 24.6 Million |
| Colorado | 1.2 | $17,900,000 | 5.84 Million | 84.2 Million |
| Massachusetts | 1.2 | $17,800,000 | 6.98 Million | 26.8 Million |
| Oregon | 1.7 | $17,000,000 | 4.24 Million | 29 Million |
| Arizona | 0.7 | $9,300,000 | 7.26 Million | 40.9 Million |
| Michigan | 0.4 | $8,900,000 | 10 Million | 113.4 Million |
| Nevada | 1.0 | $8,700,000 | 3.18 Million | 38.8 Million |
It will be interesting to see what 2023 brings to the Cannabis Beverage industry. With inflation and recession coupled with Cannabis Beverage growth, it’s sure to be something worth watching. If you are considering investing in Cannabis but have been afraid to invest based on Cannabis market reports, the Cannabis Beverage segment of the Cannabis market is gaining ground, market share, and revenue when many other segments are falling to price compression and oversupply. I hope that you found this information helpful and informative. I would like to point out that all the data contained in this report was gathered from Headset Data for AZ, CA, CO, MA, MI, NV, OR, and WA. The data reflects retail sales only in each market. There are some excellent brands climbing up the charts that I have no doubt will be in the top 10 for the USA or their respective states at the end of Q1 2023.
Q4 Stand-alone data:
For those who hoped to just see the Q4 data for Cannabis Beverages, here you go. Oct 1, 2022, to Dec 31, 2022. The total market share across states remained the same at 1.3%. The total revenue declined slightly going from $47.3 million in retail sales in Q3 to $47 million in Q4 for a -2.1% reduction in retail sales. The total units also remained the same at 4.4 million units sold for both Q3 and Q4.
| Brand Name | Total Sales | Total Units | # of Products | % of Total Sales | % of Total Units | |
| 1 | Ray’s Lemonade | $4,412,132 | 548,867 | 44 | 9.4% | 12.5% |
| 2 | Keef Cola | $3,469,174 | 386,548 | 53 | 7.4% | 8.8% |
| 3 | CANN Social Tonics | $3,164,802 | 162,877 | 40 | 6.7% | 3.7% |
| 4 | Uncle Arnie’s | $2,559,858 | 276,427 | 9 | 5.5% | 6.3% |
| 5 | Major | $2,162,383 | 240,017 | 18 | 4.6% | 5.5% |
| 6 | Sip Elixirs | $1,772,125 | 202,403 | 6 | 3.8% | 4.6% |
| 7 | Stillwater Brands | $1,757,665 | 124,236 | 14 | 3.7% | 2.8% |
| 8 | Wunder | $1,479,919 | 101,928 | 22 | 3.2% | 2.3% |
| 9 | Levia | $1,398,164 | 224,721 | 13 | 3.0% | 5.1% |
| 10 | Magic Number | $1,370,620 | 118,325 | 64 | 2.9% | 2.7% |